

The
Bull to Bear
Barometer sm is
a proprietary indicator using reported corporate profits, profit
trends, stock valuations and prevailing interest rates in a unique
calculation. |
SUBSCRIBE |
![]()
Last
Signal
|
WHEN WILL SELL SIGNAL OCCUR? STAY
TUNED
|
Welcome to SmarterBull.com!
The Purpose of SmarterBull.com is to:
1. Reveal the Bull to Bear Barometersm, a proprietary stock market major trend indicator that has been published monthly via email since January 2004.(See Track Record Chart below.)
2. Display key financial statement data of many of America’s largest companies in a colorful graphical manner making it easier for investors to comprehend financial information and make smart stock selections. Each company is ranked by its own Bull to Bear Barometersm.
SPECIAL NOTICE – January 2008
The Bull to Bear Barometer calculation utilizes interest rates taken from treasury issues among other reported financial data. These interest rates have been declining recently due in part to a flight to safety momentum caused by heightened uncertainty in the financial markets. Therefore the Bull to Bear Barometer’s reading may be higher than it would normally be. Please remember this website and its free content is not investment advice and should not be relied upon in making investment decisions.
UPDATE – January 2009
As creator and publisher of the Bull to Bear Barometer I’ve been asked why I stopped publishing the monthly barometer. I ceased publishing it after the January 2008 update mainly because it was taking too much of my time each month and was not generating any revenue. I’ve also been asked if it gave a Sell signal during 2008. Although I believe it would have signaled a Sell, I just don’t have the data to know for sure if it did or in what month.
John Adams
Bull to Bear Barometersm
as of January 31, 2008
275
125 to 150 is cautious for equities
Below 125 is negative for equitiesA Picture is worth a thousand words!!
12+
YEAR TRACK RECORD
The Bull to Bear Barometersm is a longer term indicator designed to reveal periods when it is favorable or unfavorable to generally be invested in equities versus fixed income securities. Although the DJIA increased during the period of 1981 through 1985, the average monthly yield on the 10 Year Treasury Note was 12.2% offering very good returns for those investors staying out of the stock market during that time period. Copyright 2007
SmarterBull’s YIELD WHEELsm shows the internal rates of returns of EBITDA (ttm) for the Dow Jones Industrial Average as compared to the yields on selected fixed income securities. This graphical tool is designed to help investors, analysts and investment managers determine their preference between equities and fixed income securities. Copyright - 2007
Click here to see complete listing of Stocks.
This graph above shows key financial data showing recent market valuation as compared to key financial items such as trailing twelve months (ttm) Revenues, EBITDA, Operating Profits and most recent quarter’s (mrq) Tangible Assets, Liabilities and Equity. Of special note is the level of Liabilities especially in relationship to the trailing twelve months (ttm) of EBITDA. This EBITDA to Debt ratio is less than 10%. Copyright - 2007
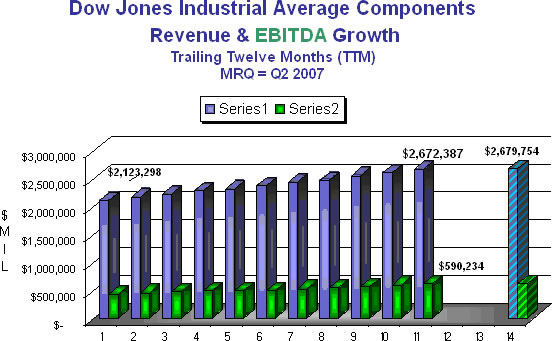
This graph shows the trend growth in both revenues and EBITDA of the DJIA component companies using a trailing 12 month (ttm) model. The Linear Projection is a simple average rate of change calculation and not an analytical forecast. Copyright 2007
The unique graph above shows recent market valuation along side to key financial items such as trailing twelve months (ttm) Revenues, EBITDA, Operating Profits and most recent quarter’s (mrq) Tangible Assets, Liabilities, Working Capital and Equity. Copyright - 2007
Click here to see complete listing of Stocks.
This unique graph shows how Revenues (ttm) and EBITDA (ttm) are trending on a quarter to quarter basis over the past 5 quarters. The Linear Projection is a simple average rate of change calculation and not an analytical forecast. Copyright – 2007
The unique graph above shows recent market valuation along side to key financial items such as trailing twelve months (ttm) Revenues, EBITDA, Operating Profits and most recent quarter’s (mrq) Tangible Assets, Liabilities, Working Capital and Equity. Copyright - 2007
This unique graph above shows recent market valuation along side to key financial items such as trailing twelve months (ttm) Revenues, EBITDA, Operating Profits and most recent quarter’s (mrq) Tangible Assets, Liabilities, Working Capital and Equity. Copyright - 2007


 |
Meridyne Corporation - 1205 Tedford Way Oklahoma City, OK 73116 405-848-0049
Disclaimer